
Google Analytics: Integration, Segmentation and Customization
Several years ago, we featured a series of blog articles titled ‘The Beginners Guide to Google Analytics’. In this 3-part series we covered the basics to getting started with Google Analytics and details on the following:
While there have been many updates over the years, the basics are very much the same. In this article, I’ll focus on a few new features that have been added since our series that will take your Analytics to the next level.
Integration: Google Tag Manager
Google Tag Manager (GTM) is another free tool offered by Google for tag management. What kinds of tags you ask? Tags like…wait for it…Google Analytics. It’s not limited to Analytics though. Google Adwords, DoubleClick, Adometry, and many more are integrated natively, but customer HTML tags can also be added.
In addition to simple integration of the Google Analytics tag snippet to enable tracking, there are many more things that GTM allows you to do for more advanced tracking. Creating custom events, transaction tracking, social tracking and more can all be managed and controlled from one central account without ever having to touch the code of the website. The less you have to talk to your web developer the better, right?
Segmentation: Comparing Segments
Seeing the overall traffic and stats for the site are great, but sometimes you want to know how the site was being used by a particular subset of users. This is where segments come in.
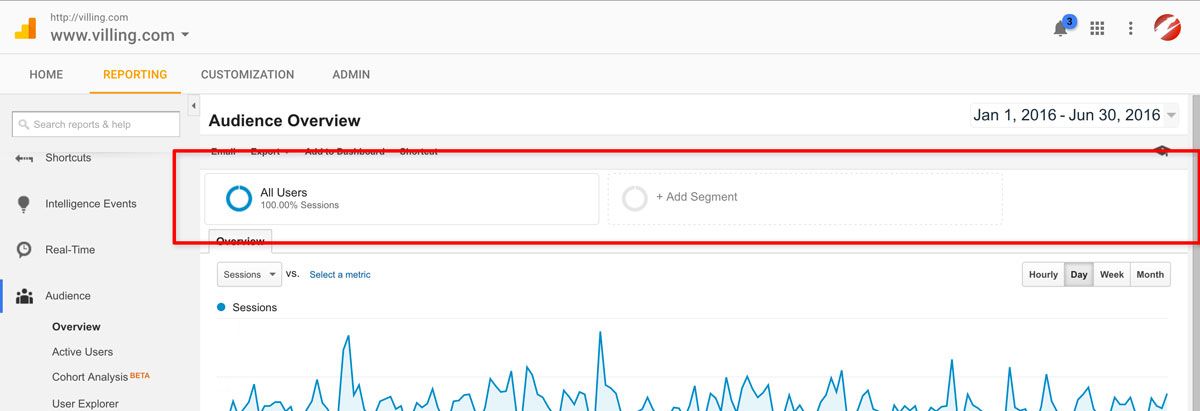
At the top each the page near the date pickers is a row that indicates which segments are currently applied and a link to add a segment. Clicking either the apply ‘Add Segment’ button or clicking an existing segment box will both bring up the dialog box to select which segments to apply.
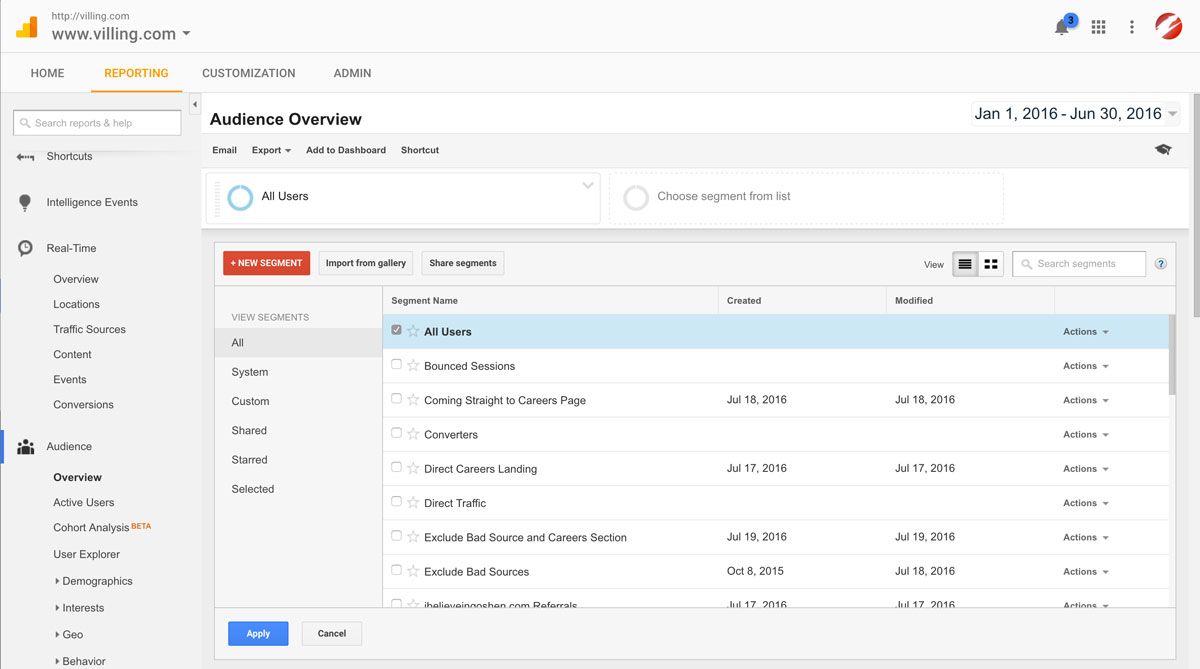
Using this dialog, you can select as many segments as needed and apply them. Once the segments are applied, the entire Analytics system can be used and the data will properly filter based on each applied segment. All applied segments are listed on screen making them easy to compare.
Google Analytics also allows for the creation of custom segments. Because this is my article (and I’m a bit vain), let’s segment out all the users that have visited my bio page.
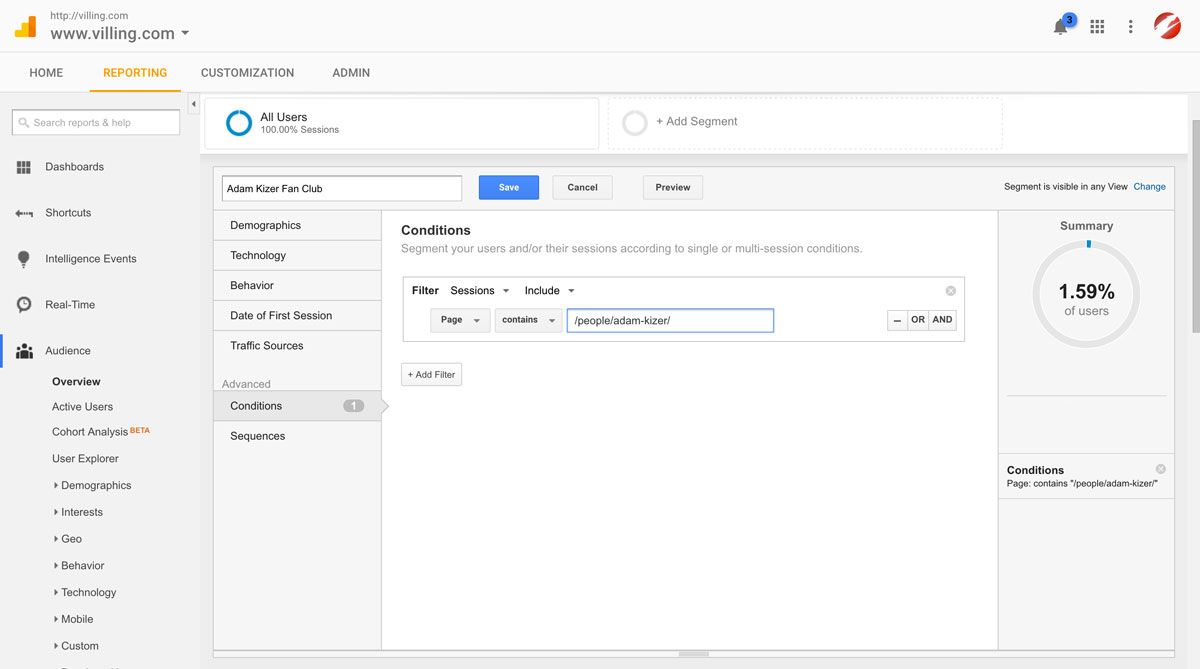
Depressingly in the first half of 2016 only 1.59% of all users to the Villing website have visited my bio page. I would have hoped for more, but I’ll try not to take it personal and move along.
Once the segment is created and applied, the segmented data is listed for each tool in the system. If the ‘All Users’ or another segment were also selected in the segments dialog, those results will also be listed.
One important note: Segments return all data for sessions/visits that meet the matched conditions. Because of this, all session data is displayed using a segment. For instance, the segment above contains Analytics for all pages on the site by users that have visited my bio and not just Analytics for my bio page. If we wanted to filter out data and only get the information pertinent to my bio page, we could create a custom report.
Customization: Creating Custom Reports
Segments are very useful, but sometimes they can’t give you the exact data you need. By using filters in custom reports, interesting and useful data can be extracted and studied.
To start, click on the ‘Customization’ tab in the main menu at the top of the screen. On the main landing page, click ‘+ New Custom Report’.
There are many options and setting for reports that are beyond the scope of this article, but we’ll stick to the basics.
-
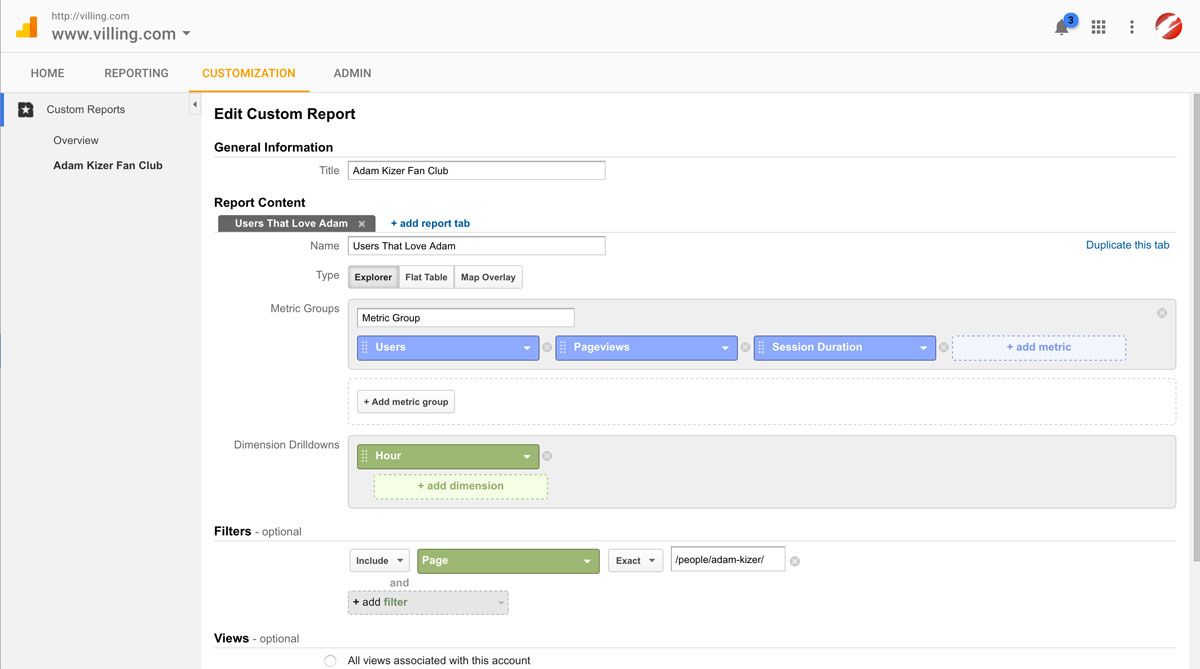
Metrics – The type of data to be returned. These are grouped and multiple groups can be added.
-
Dimension Drilldowns – The dimensions by which the data will be grouped and displayed. Multiple dimensions can be assigned and drilled down.
-
Filters – One or more filters can be set to get the data you need.
Once the report is created, the custom report will report data. In our example, data was pulled for users that visited my page (filter) at what hour of the day (dimension).
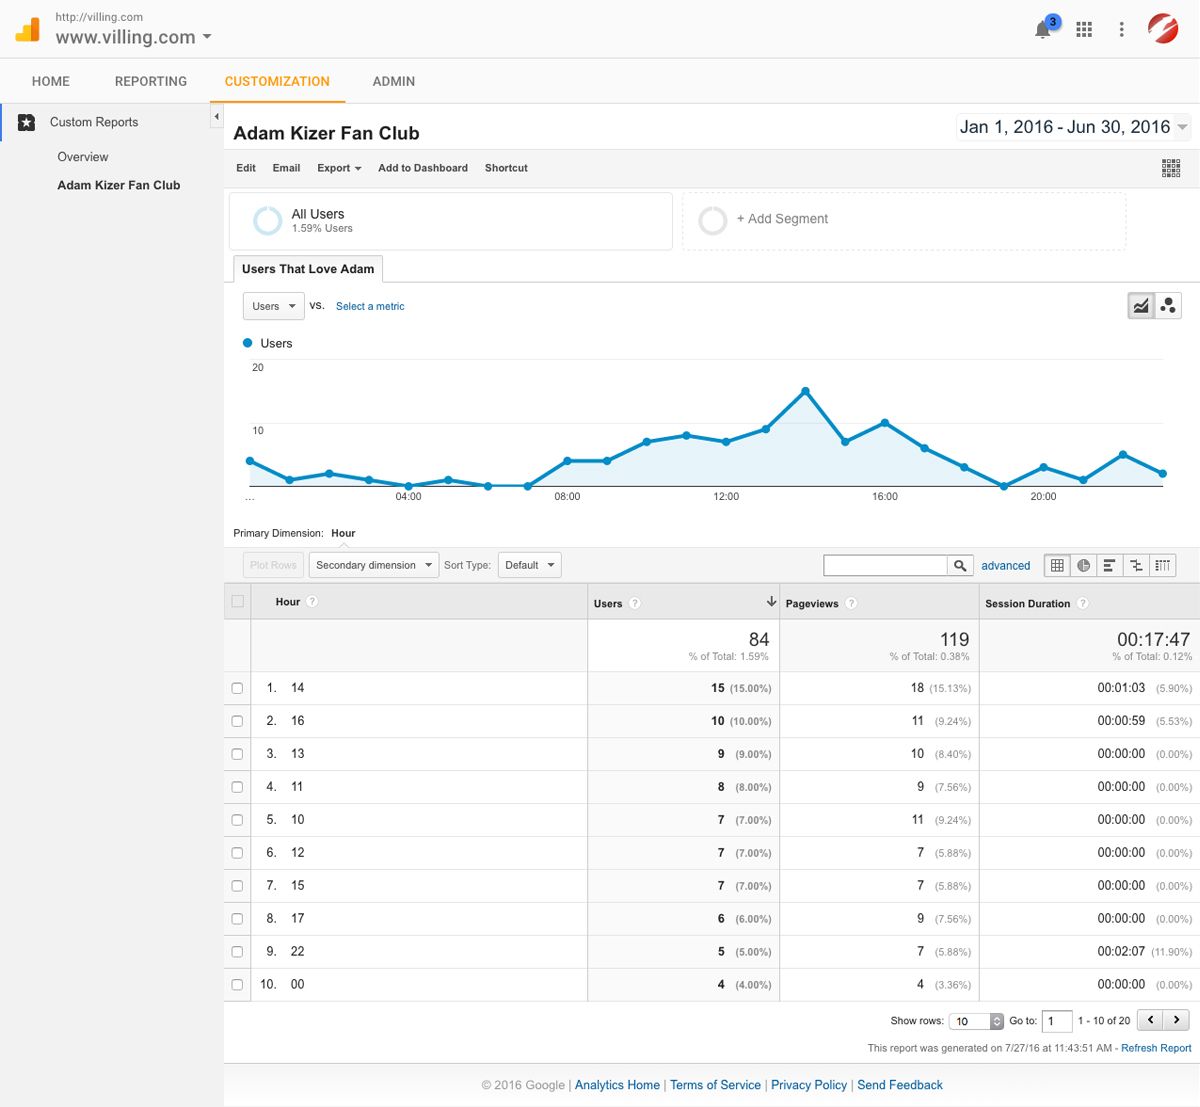
Doing some quick analysis on the report, it appears that most users were looking at my page in the late morning to early afternoon hours. There were a few (4) creeps that had to see my beautiful face at midnight, so I’m not sure what to make of that.
While this custom report doesn’t really yield any useful data, it does demonstrate the ability to pull extremely specific data for whatever metric is needed. Every filter, metric and dimensions within Analytics is available within these custom reports to mix and match to get the exact data you need.
Google is constantly releasing new offerings, but these features are foundational to success with Google Analytics. Having a solid grasp on how to use them will assist you as you seek to better track your online marketing efforts.